In a nutshell
Households in Arab countries have the second lowest rate of growth pass-through in the world after sub-Saharan Africa: for every 1% growth in the private consumption expenditure component of GDP, only a third of it is experienced at household levels.
Weak growth pass-through (which is evident even in some high-and middle-income Arab countries) is linked in part to the impact of Covid-19; but the pandemic is not the main factor behind the modest reduction in poverty levels indicated by the latest projections.
In designing national poverty reduction plans, Arab countries should focus not only on policies that promote GDP growth at the national level but also on how to boost the pass-through to household incomes, especially for the lowest earners.
The way in which economic growth is distributed to households, especially the lowest earners, is a major determinant of poverty reduction outcomes. If the income of the poorest households grows at a rate higher than the average, then the growth process is generally considered to be pro-poor (and vice versa in the case of anti-poor growth).
But the distributional challenge is not the only factor that matters for poverty levels or poverty reduction dynamics. As argued in a recent study – ‘Obstructed poverty reduction: growth pass-through analysis’ – by the Economic and Social Commission for Western Asia (ESCWA), we need to make sure that households (or the vast majority of them who are captured by surveys) experience that economic growth in the first place. In countries where the national accounts and household consumption grow at the same rate, there is a full growth pass-through.
There are a number of reasons why we expect differences between national accounts and survey-based estimates of consumption growth. For example, the former can understate mean consumption and overstate the number of individuals in poverty when wealthier households under-comply with the survey compared to poor households. Recent research suggests that selective non-compliance may be a problem in both tails of the distribution.
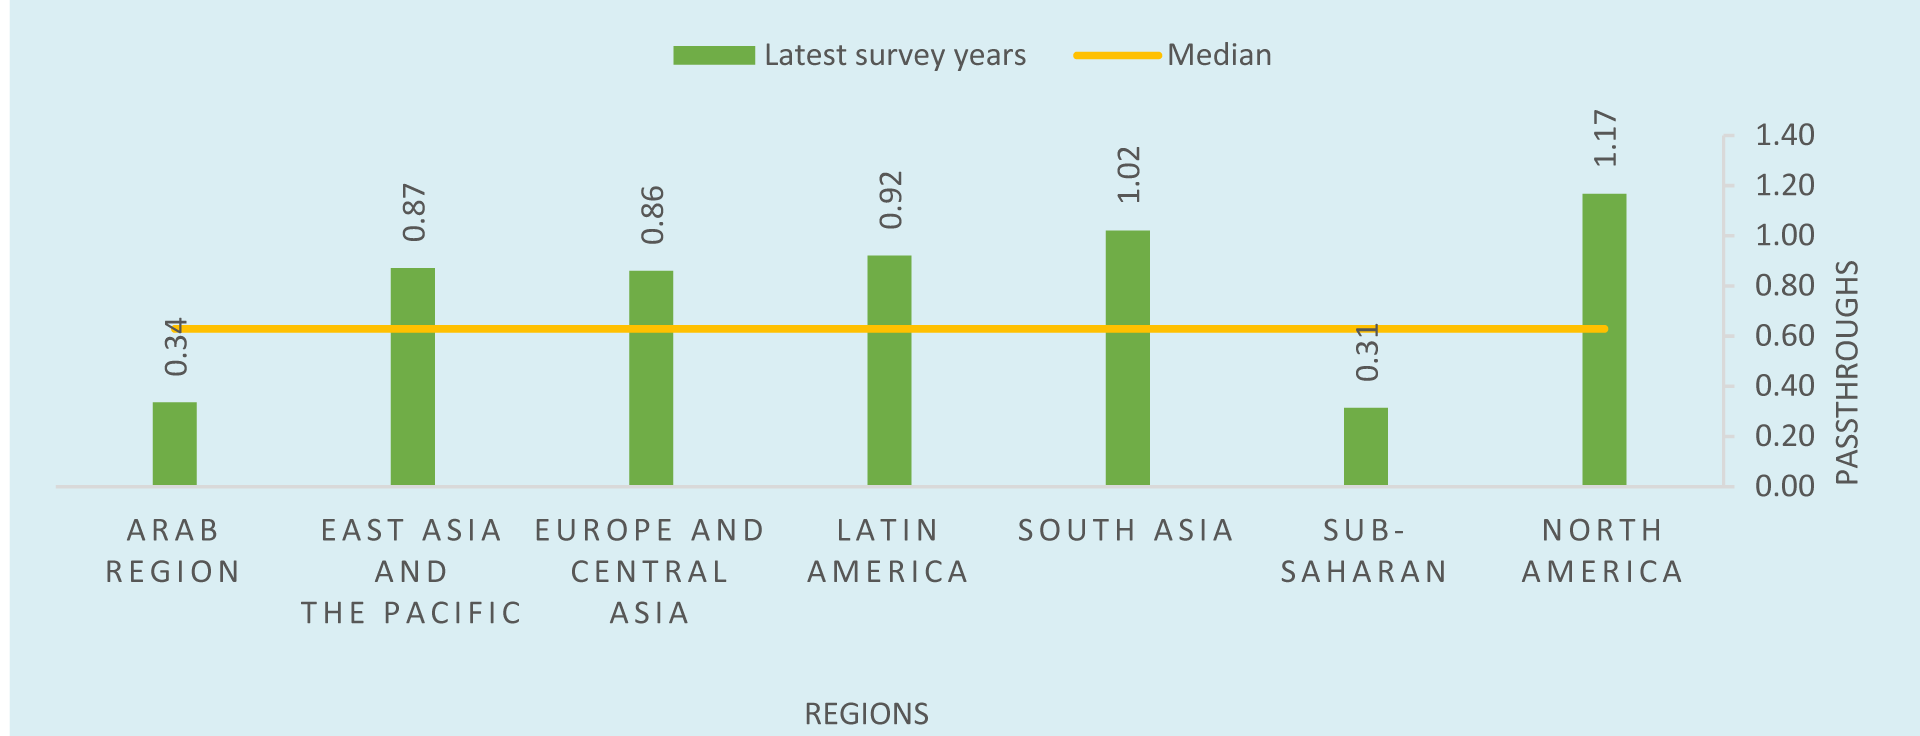
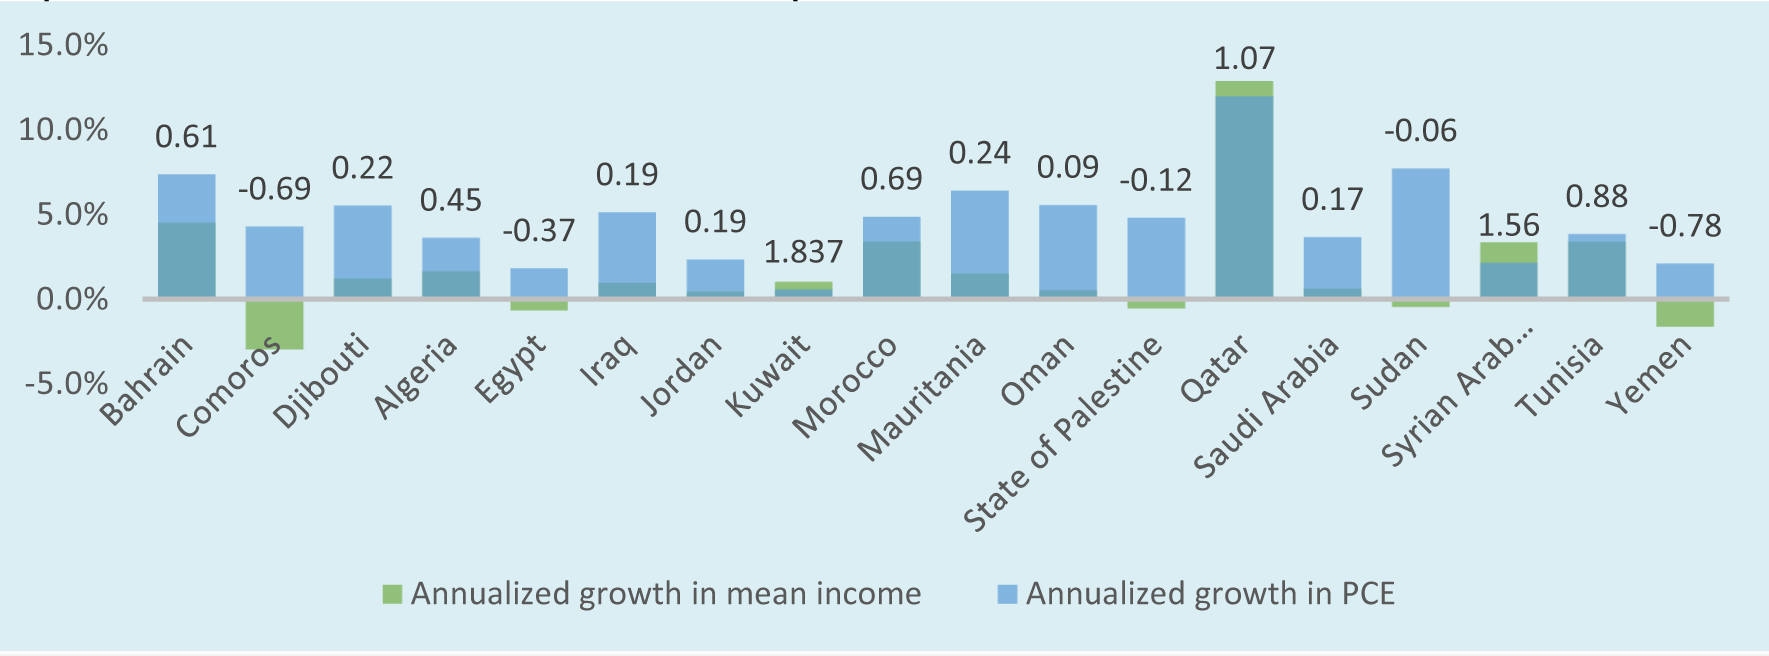
Regardless of the reasons why, according to most recent household income and expenditure survey data, households in Arab countries have the second lowest growth pass-through rate in the world after sub-Saharan Africa: for every 1% growth in private consumption expenditure (PCE) component of the GDP, on average, only one third of it is experienced at household levels (see Figure 1). Moreover, the low pass-through rate for the Arab region is evident even for some high-and middle-income countries (see Figure 2).
Figure 1: Observed pass-through across world regions (Country population weighted)
Source: Authors’ calculations.
Note: The orange line is the global pass-through average of 0.629 for the latest spell. The spell is a range of years between two points in time for a given country. The sample of data used in this study produces spell ranges that vary from one year for some of the countries to 18 years for other countries. A country can have one or several spells depending on the number of surveys available in the sample of data.
Figure 2: Annualised growth in survey-based mean income/consumption expenditure and PCE over the latest spell
Source: Authors’ calculations.
Note: The values at the top of each bar are the observed pass-through ratio. The pass-through rate for the Syrian Arab Republic was based on old survey years.
The ESCWA study also has two other key findings. First, developed countries with low poverty rates have high pass-through rates, meaning that a large portion of the growth in national accounts in such countries is passed through to household income/consumption expenditure, as reflected in surveys. For developing countries, the higher the poverty headcount, the lower this fraction.
Second, pass-through rates do not appear to be clustered by geographical region per se, but by economic and demographic divides, forming distinct subgroups. Other factors such as population density also become relevant at the deeper level of clustering. Ultimately, none of the considered factors solely determine a country’s pass-through rate, but it is complex interactions (as sieved out by the clustering methods) that help to explain it.
Implications for poverty reduction
The pandemic has renewed interest in poverty estimation and policy-makers are now frequently asking for advice on poverty reduction policies. This is especially the case in Arab countries where ESCWA reports indicate that the pandemic may have pushed an additional 16 million people below national poverty lines and an additional nine million people below extreme poverty lines (using the $1.90 poverty line).
With the war in Ukraine pushing fuel and food prices upwards, the two pertinent questions are what are the poverty implications; and what can be done, especially by policy-makers.
On the first question, the main argument of the ESCWA study is that the forecast poverty narrative will very much depend on whether or not the growth pass-through is taken into account. As surveys are not regularly updated for most countries, some adjustment is needed to allow for continuous poverty monitoring at national, regional or global levels.
To align cross-country poverty comparisons to a common reference year, national accounts data remain the best option available to interpolate and extrapolate survey estimates. Hence, we continue to use national accounts forecasts to model expected changes in household income/expenditure, which are then applied to project future poverty rates.
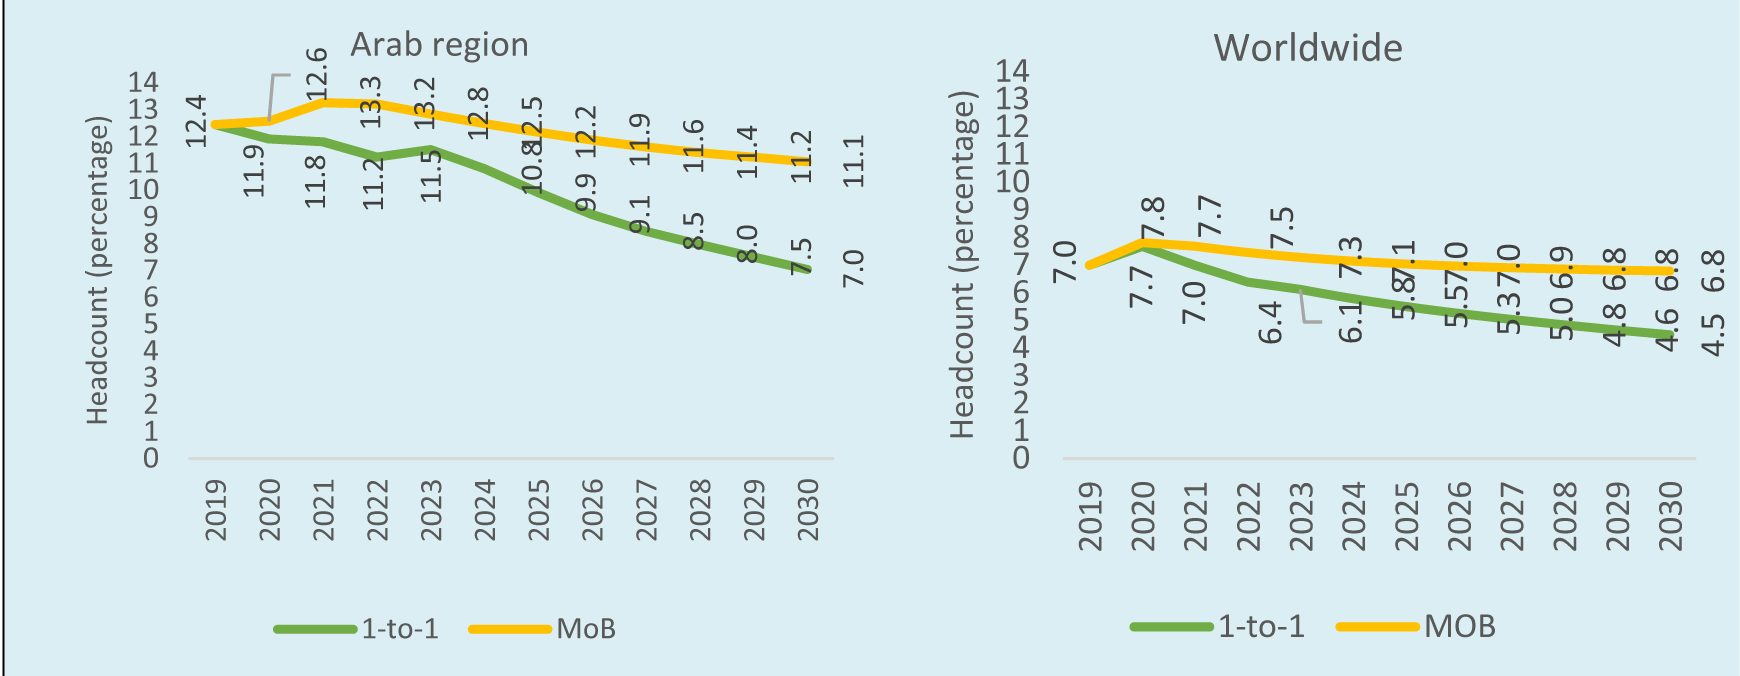
Figure 3: Extreme poverty headcount ratios, per region and globally (2019-2030), as measured by $1.9 (2011 PPP)
Source: Authors’ calculations.
Notes: MOB is Model Based Recursive Partioning Clustering Method
Building on these national accounts estimates and forecasts, the study proposes a poverty estimation/forecasting methodology that adjusts growth in household income or consumption based on a more realistic pass-through factor. Fortunately, research on this issue is well developed. Approaches for estimating pass-through rates have been advocated since the early 2000s, and pass-through factors are expected to vary across different contexts, according to geographical region, income level, welfare measure used (income or consumption), time and other circumstances.
The new ESCWA study builds on this research (mainly by the World Bank) to present several options for forecasting pass-through effects and forecasts headcount poverty till 2030 at the global and regional levels using the international extreme poverty line of $1.90 per day as well as national poverty lines.
Two poverty trends are thus forecast for 183 countries covering the period from 2020 to 2030: first, using full pass-through (PCE growth in national accounts growth is fully reflected in the income/consumption expenditure in household surveys); and second, using pass-through calculated by a MOB cluster technique. For simplicity, the authors base their results on neutral-growth income distribution assumption.
The global and Arab regional poverty trends (country-population weighted) are presented in Figure 3. As expected, the results show the headcount poverty ratios increasing for the Arab region and globally in 2020 regardless of the model used, due to the negative PCE growth projections under the pandemic and related economic shocks. Most critically, the pass-through effect has a large impact on the projected poverty rates, especially for the Arab region. In the best-case full growth pass-through scenario, extreme poverty can be nearly halved by 2030.
But with more realistic scenarios, where modelled growth pass-through results are applied, the poverty forecasts show only a slight dent from their 2019 baseline. Another conclusion to draw from the figures is that the gap between these scenarios is narrower at the global level, indicating, as mentioned above, that growth pass-through plays a more decisive role for Arab countries.
Policy Implications
Two policy implications of these findings are clear. First, Arab countries, especially poorer and oil-importing countries, should be concerned with macroeconomic policies that enhance GDP growth, as there is insufficient growth in national income to reach households, let alone to meet poverty reduction targets.
Second, a weaker growth-poverty nexus gives way to stronger responsiveness to shifts in income inequality. Policies targeting inequality reduction should thus be made a priority.
To elaborate more, in Sudan, an increase in mean consumption expenditure of 1% was expected to decrease headcount ratio by 1.89%. But having a pass-through ratio of 0.304 changed the effective GEP to 0.57%, significantly lower than the effect induced by a 1% change in inequality.
We evaluated the relative effects of growth and inequality-targeting policies worldwide for 2020. In countries where the inequality elasticity of poverty reduction exceeded the GEP in absolute value, this relationship was overturned in 63% of countries once the pass-through factors were taken into account. Having a low pass-through factor can create a growth trap with significant impact on a country’s prescribed pathway toward poverty reduction.
To address the growth trap, policy-makers should focus on policies that augment the pass-through. This means focusing not only on job creation, but also on moving workers from low-paying jobs in primary and basic service sectors to ones where there are higher income and productivity growth prospects. But this also means more focus on inequality-centred poverty reduction policies.
Finally, several follow-up research activities can be envisaged that build on the methodology and use these findings. For example, the pass-through forecasting methodology can be refined further by improving the model specification and particularly by examining the link between the size of the pass-through and under-reporting of top incomes.
The poverty story would also not be complete without an equivalent analysis of inequality projections, which is inherently more complex. The forecasting methodology in this study will also provide the logical basis for ESCWA’s forthcoming money metric poverty projection tool – a web-based system with a user-friendly interface where users can simulate the impact of various growth and inequality scenarios on money metric poverty at national, regional and global levels.
Further reading
Khalid Abu-Ismail, Mohammed Al-Bizri, Hassan Hamie, Vladimir Hlasny and Jinane Jouni (2022) ‘Obstructed poverty reduction: growth pass-through analysis’, United Nations Economic and Social Commission for Western Asia E/ESCWA/CL3.SEP/2022/TP.18.


